Multiple Choice
Use the figure to calculate the income elasticity of demand when income increases from $25,000 to $30,000: 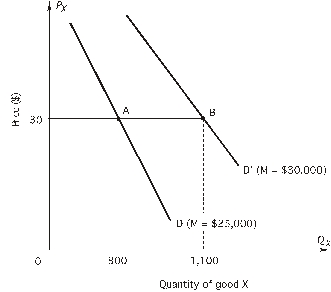
A) -0.10
B) -1.10
C) 0.1818
D) 0.20
E) 1.10
Correct Answer:

Verified
Correct Answer:
Verified
Related Questions
Q16: To answer the question,refer to the
Q17: When marginal revenue is zero,<br>A)P < MR.<br>B)P
Q18: According to the following figure,the equation for
Q19: the figure below,which shows a linear demand
Q20: The cross-price elasticity of demand between goods
Q22: Refer to the following figure.When price is
Q23: To answer the question,refer to the
Q24: Refer to the following graph to answer
Q25: Refer to the following graph to answer
Q26: To answer the question,refer to the