Multiple Choice
The figure below shows a consumer maximizing utility at two different prices (the left panel) and the consumer's demand for good X at the same two prices of good X (the right panel) .The price of good Y is $14.What is the consumer's income? 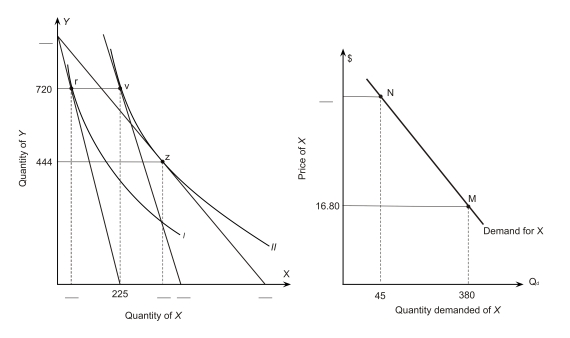
A) $12,000
B) $12,200
C) $12,250
D) $12,400
E) $12,600
Correct Answer:

Verified
Correct Answer:
Verified
Q88: According to the following figure,what could have
Q89: The figure below shows a consumer maximizing
Q90: Assume that an individual consumes two
Q91: A consumer has the indifference map shown
Q92: Suppose that 2 units of X and
Q94: If Ferdinand prefers a Big Mac to
Q95: The following figure shows a portion of
Q96: A consumer has the indifference map shown
Q97: Refer to the following indifference map for
Q98: Assume that an individual consumes two