Multiple Choice
The figure below shows a consumer maximizing utility at two different prices (the left panel) and the consumer's demand for good X at the same two prices of good X (the right panel) .The price of good Y is $14.The equation of the budget line passing through point r is _______________. 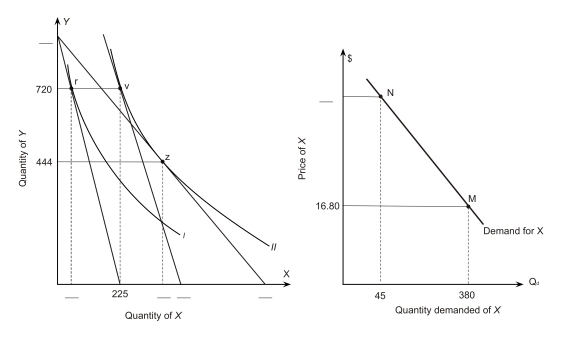
A) Y = 800 - 4X
B) Y = 900 - 4X
C) Y = 800 - 5X
D) Y = 900 - 5X
Correct Answer:

Verified
Correct Answer:
Verified
Q84: In the following graph the price of
Q85: The figure below shows a consumer maximizing
Q86: If a consumer is choosing the bundle
Q87: <img src="https://d2lvgg3v3hfg70.cloudfront.net/TB7882/.jpg" alt=" The
Q88: According to the following figure,what could have
Q90: Assume that an individual consumes two
Q91: A consumer has the indifference map shown
Q92: Suppose that 2 units of X and
Q93: The figure below shows a consumer maximizing
Q94: If Ferdinand prefers a Big Mac to