Multiple Choice
The figure below shows a consumer maximizing utility at two different prices (the left panel) and the consumer's demand for good X at the same two prices of good X (the right panel) .The price of good Y is $14.At point N on the demand curve for X,the price of X is $____. 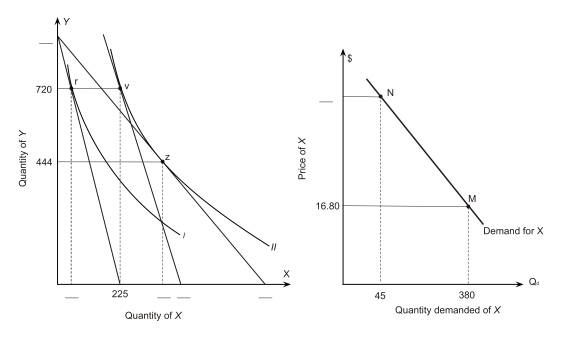
A) $48
B) $50
C) $56
D) $60
E) $64
Correct Answer:

Verified
Correct Answer:
Verified
Q80: In the following graph the price of
Q81: What is the equation for budget line
Q82: A consumer has the indifference map shown
Q83: A market demand curve<br>A)is the horizontal summation
Q84: In the following graph the price of
Q86: If a consumer is choosing the bundle
Q87: <img src="https://d2lvgg3v3hfg70.cloudfront.net/TB7882/.jpg" alt=" The
Q88: According to the following figure,what could have
Q89: The figure below shows a consumer maximizing
Q90: Assume that an individual consumes two