Multiple Choice
The figure below shows a consumer maximizing utility at two different prices (the left panel) and the consumer's demand for good X at the same two prices of good X (the right panel) .The price of good Y is $14.When the price of X increases from point M to point N along the demand curve,the substitution effect of the price increase is ________. 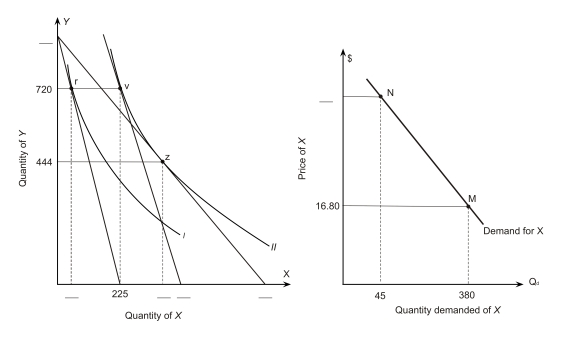
A) -135
B) -140
C) -145
D) -150
E) -155
Correct Answer:

Verified
Correct Answer:
Verified
Q95: The following figure shows a portion of
Q96: A consumer has the indifference map shown
Q97: Refer to the following indifference map for
Q98: Assume that an individual consumes two
Q99: <img src="https://d2lvgg3v3hfg70.cloudfront.net/TB7882/.jpg" alt=" -According to the
Q100: The following figure shows a portion of
Q101: The following figure shows a portion of
Q102: Lulu consumes only candy and cookies; she
Q103: The figure below shows a consumer maximizing
Q105: The figure below shows a consumer maximizing