Multiple Choice
The following figure shows a portion of a consumer's indifference map and budget lines.The price of good Y is $17 and the consumer's income is $7,650.Let the consumer begin in utility-maximizing equilibrium at point A on indifference curve II.Next the price of good X changes so that the consumer moves to a new utility-maximizing equilibrium at point B on indifference curve I.The substitution effect of the change in the price of X is 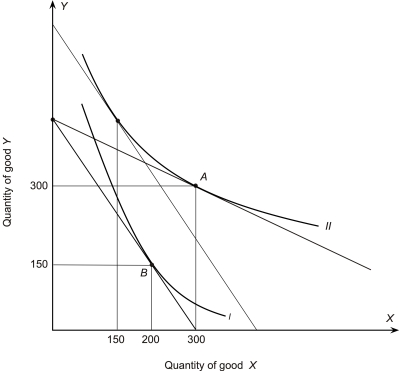
A) 50
B) 100
C) 150
D) -100
E) -150
Correct Answer:

Verified
Correct Answer:
Verified
Q95: The following figure shows a portion of
Q96: A consumer has the indifference map shown
Q97: Refer to the following indifference map for
Q98: Assume that an individual consumes two
Q99: <img src="https://d2lvgg3v3hfg70.cloudfront.net/TB7882/.jpg" alt=" -According to the
Q100: The following figure shows a portion of
Q102: Lulu consumes only candy and cookies; she
Q103: The figure below shows a consumer maximizing
Q104: The figure below shows a consumer maximizing
Q105: The figure below shows a consumer maximizing