Multiple Choice
The figure below shows a consumer maximizing utility at two different prices (the left panel) and the consumer's demand for good X at the same two prices of good X (the right panel) .The price of good Y is $14.When the price of X increases from point M to point N along the demand curve,the total effect of the price increase is ________. 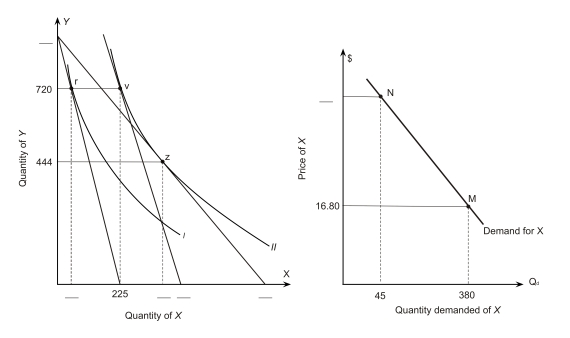
A) -335
B) -425
C) +20
D) +40
Correct Answer:

Verified
Correct Answer:
Verified
Q14: A consumer has the indifference map shown
Q15: In the following figure,a consumer faces a
Q16: Lord Greystroke uses his limited income to
Q17: Based on the following graph,what is the
Q18: <img src="https://d2lvgg3v3hfg70.cloudfront.net/TB7882/.jpg" alt=" The
Q20: Based on the following graph,one point on
Q21: Refer to the following indifference map for
Q22: The figure below shows a consumer maximizing
Q23: The price of X is $20 and
Q24: According to the following figure,at point A,