Multiple Choice
The figure below shows a consumer maximizing utility at two different prices (the left panel) and the consumer's demand for good X at the same two prices of good X (the right panel) .The price of good Y is $14.When the price of X increases from point M to point N along the demand curve,it is clear that good X ___________ (is,is not) a Giffen good because _______________. 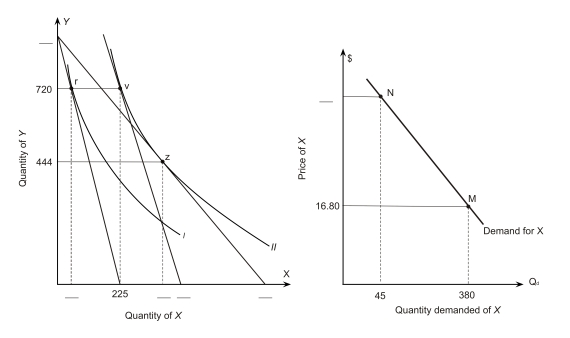
A) is; the total effect of the price increase is negative.
B) is; the income effect reinforces the substitution effect.
C) is; the income effect is larger than the substitution effect.
D) is not; the substitution effect reinforces the income effect.
E) is not; good X is an inferior good.
Correct Answer:

Verified
Correct Answer:
Verified
Q17: Based on the following graph,what is the
Q18: <img src="https://d2lvgg3v3hfg70.cloudfront.net/TB7882/.jpg" alt=" The
Q19: The figure below shows a consumer maximizing
Q20: Based on the following graph,one point on
Q21: Refer to the following indifference map for
Q23: The price of X is $20 and
Q24: According to the following figure,at point A,
Q25: typical indifference curve<br>A)shows all combinations of goods
Q26: The consumer faces a budget constraint because
Q27: <img src="https://d2lvgg3v3hfg70.cloudfront.net/TB7882/.jpg" alt=" -According to the