Multiple Choice
The following figure shows a portion of a consumer's indifference map and budget lines.The price of good Y is $17 and the consumer's income is $7,650.Let the consumer begin in utility-maximizing equilibrium at point A on indifference curve II.Next the price of good X changes so that the consumer moves to a new utility-maximizing equilibrium at point B on indifference curve I.Good X is a(an) ___________ good but not a _________ good. 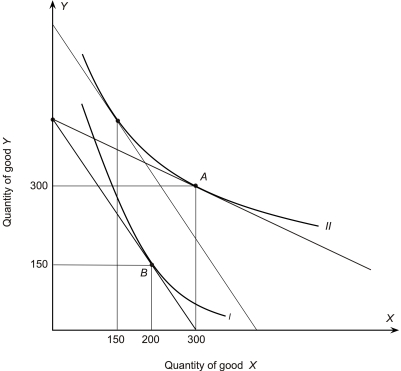
A) normal; substitute
B) normal; Giffen
C) inferior; Giffen
D) Giffen; normal
E) Giffen; substitute
Correct Answer:

Verified
Correct Answer:
Verified
Q52: The market demand curve<br>A)shows how much all
Q53: According to the Rolling Stones,"You can't always
Q54: <img src="https://d2lvgg3v3hfg70.cloudfront.net/TB7882/.jpg" alt=" The consumer's income
Q55: In the following graph the price of
Q56: <img src="https://d2lvgg3v3hfg70.cloudfront.net/TB7882/.jpg" alt=" The consumer's income
Q58: The following figure shows a portion of
Q59: A consumer has the indifference map shown
Q60: <br>The price of X is $20 and
Q61: Alexandra consumes only caviar and champagne,but she
Q62: The consumer chooses the bundle of goods