Multiple Choice
In the following graph the price of Y is $50.The consumer's demand curve for X is 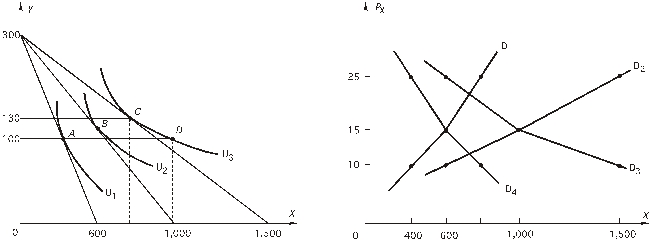
A) D1.
B) D2.
C) D3.
D) D4.
Correct Answer:

Verified
Correct Answer:
Verified
Related Questions
Q50: In the following graph the price of
Q51: The following figure shows a portion of
Q52: The market demand curve<br>A)shows how much all
Q53: According to the Rolling Stones,"You can't always
Q54: <img src="https://d2lvgg3v3hfg70.cloudfront.net/TB7882/.jpg" alt=" The consumer's income
Q56: <img src="https://d2lvgg3v3hfg70.cloudfront.net/TB7882/.jpg" alt=" The consumer's income
Q57: The following figure shows a portion of
Q58: The following figure shows a portion of
Q59: A consumer has the indifference map shown
Q60: <br>The price of X is $20 and