Multiple Choice
The following figure shows a portion of a consumer's indifference map and budget lines.The price of good Y is $7 and the consumer's income is $700.Let the consumer begin in utility-maximizing equilibrium at point A on indifference curve I.Next the price of good X changes so that the consumer moves to a new utility-maximizing equilibrium at point B on indifference curve II.Which of the following points are NOT points on this consumer's demand curve? 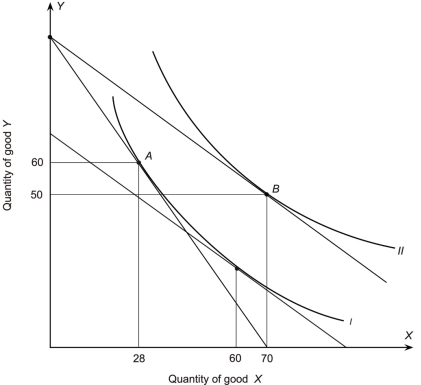
A) Px = $5 and Qx = 60
B) Px = $10 and Qx = 70
C) Px = $5 and Qx = 70
D) Px = $10 and Qx = 28
E) a and b are NOT points on demand
Correct Answer:

Verified
Correct Answer:
Verified
Q46: Ronald,who consumes only hamburgers and hot dogs,has
Q47: What is the equation for budget line
Q48: The price of X is $20 and
Q49: Ms.Birnbaum is buying bottles of beer and
Q50: In the following graph the price of
Q52: The market demand curve<br>A)shows how much all
Q53: According to the Rolling Stones,"You can't always
Q54: <img src="https://d2lvgg3v3hfg70.cloudfront.net/TB7882/.jpg" alt=" The consumer's income
Q55: In the following graph the price of
Q56: <img src="https://d2lvgg3v3hfg70.cloudfront.net/TB7882/.jpg" alt=" The consumer's income