Multiple Choice
The following figure shows a portion of a consumer's indifference map and budget lines.The price of good Y is $7 and the consumer's income is $700.Let the consumer begin in utility-maximizing equilibrium at point A on indifference curve I.Next the price of good X changes so that the consumer moves to a new utility-maximizing equilibrium at point B on indifference curve II.The substitution effect of the change in the price of X is 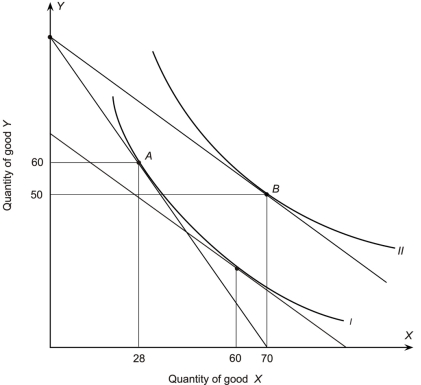
A) +12
B) +10
C) -10
D) +32
E) +42
Correct Answer:

Verified
Correct Answer:
Verified
Q5: Suppose that utility-maximizing consumers in San Francisco
Q6: Assume James purchases only two goods,steak and
Q7: Which of the following is NOT a
Q8: The figure below shows a consumer maximizing
Q9: Assume James purchases only two goods,steak and
Q11: In the following graph the consumer's income
Q12: Based on the following graph,if the price
Q13: Assume that an individual consumes two
Q14: A consumer has the indifference map shown
Q15: In the following figure,a consumer faces a