Multiple Choice
The figure below shows a consumer maximizing utility at two different prices (the left panel) and the consumer's demand for good X at the same two prices of good X (the right panel) .The price of good Y is $4.50.The equation of the budget line passing through point r is _______________. 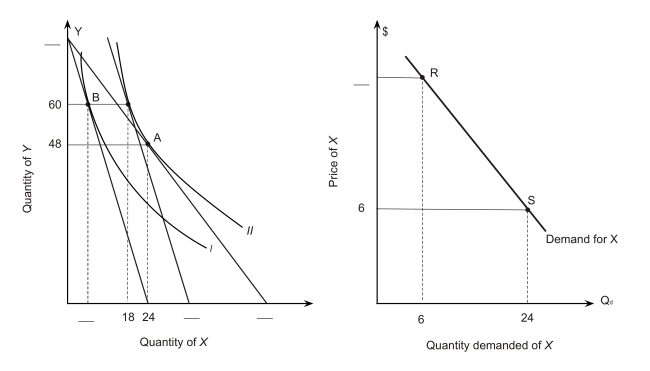
A) Y = 80 - (10/3) X
B) Y = 90 - (10/3) X
C) Y = 80 - 0.3X
D) Y = 90 - 0.3X
Correct Answer:

Verified
Correct Answer:
Verified
Q3: The figure below shows a consumer maximizing
Q4: The figure below shows a consumer maximizing
Q5: Suppose that utility-maximizing consumers in San Francisco
Q6: Assume James purchases only two goods,steak and
Q7: Which of the following is NOT a
Q9: Assume James purchases only two goods,steak and
Q10: The following figure shows a portion of
Q11: In the following graph the consumer's income
Q12: Based on the following graph,if the price
Q13: Assume that an individual consumes two