Multiple Choice
Which of these statistics BEST describes the relationship in this scatterplot? 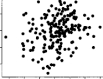
A) r = -1.00
B) r = .05
C) r = -.50
D) r = .45
Correct Answer:

Verified
Correct Answer:
Verified
Related Questions
Q1: A researcher collects data from 12
Q3: The difference between correlational statistics and correlational
Q4: A researcher wishing to correlate two
Q5: For which of these research situations would
Q6: An instructor finds the more often students
Q7: A Pearson correlation of .00 is BEST
Q8: Calculating the Pearson correlation involves calculating eight
Q9: For which of these research situations would
Q10: Which of these statistics BEST describes the
Q11: A researcher wishing to correlate two variables