Multiple Choice
(a) Density dependence: Growth rate slows at high density.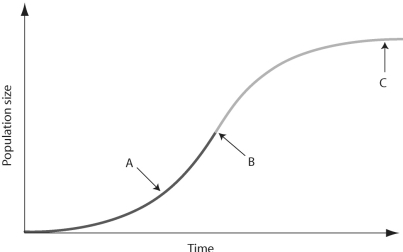 Figure 51.5
-In the figure above, which of the arrows represents the carrying capacity?
A) arrow A
B) arrow B
C) arrow C
Correct Answer:

Verified
Correct Answer:
Verified
Q5: <img src="https://d2lvgg3v3hfg70.cloudfront.net/TB6548/.jpg" alt=" Figure 51.3 -Looking
Q6: (a)<br><img src="https://d2lvgg3v3hfg70.cloudfront.net/TB6548/.jpg" alt="(a) (b)
Q7: The definition of a generation is<br>A) 20
Q8: What is the primary limiting factor that
Q9: Use the following abstract from Theoretical Population
Q11: <img src="https://d2lvgg3v3hfg70.cloudfront.net/TB6548/.jpg" alt=" Figure 51.1 -In
Q12: <img src="https://d2lvgg3v3hfg70.cloudfront.net/TB6548/.jpg" alt="
Q13: (a)<br><img src="https://d2lvgg3v3hfg70.cloudfront.net/TB6548/.jpg" alt="(a) (b)
Q14: Use the following abstract from Theoretical Population
Q15: <img src="https://d2lvgg3v3hfg70.cloudfront.net/TB6548/.jpg" alt=" Figure 51.1 -In