Multiple Choice
(a) 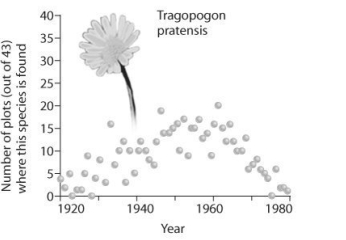
(b) 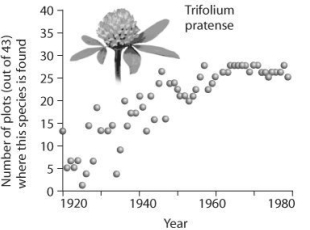
(c) 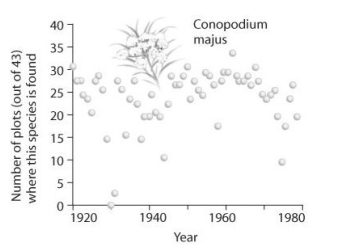 Figure 51.8
-Based on the graphs in the figure above from the Park Grass study, which species declines in population over time?
A) Conopodium majus
B) Trifolium pratense
C) Tragopogon pratensis
D) All species populations decline at some point in time.
Correct Answer:

Verified
Correct Answer:
Verified
Q8: What is the primary limiting factor that
Q9: Use the following abstract from Theoretical Population
Q10: (a) Density dependence: Growth rate slows at
Q11: <img src="https://d2lvgg3v3hfg70.cloudfront.net/TB6548/.jpg" alt=" Figure 51.1 -In
Q12: <img src="https://d2lvgg3v3hfg70.cloudfront.net/TB6548/.jpg" alt="
Q14: Use the following abstract from Theoretical Population
Q15: <img src="https://d2lvgg3v3hfg70.cloudfront.net/TB6548/.jpg" alt=" Figure 51.1 -In
Q16: It is estimated that snow geese will
Q17: <span class="ql-formula" data-value="\text {Life Table for Lacerta
Q18: In 1987, there were only 22 condors