Multiple Choice
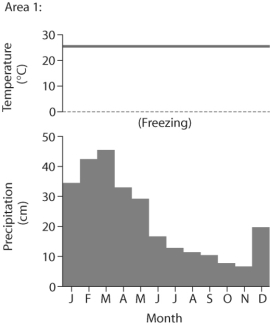
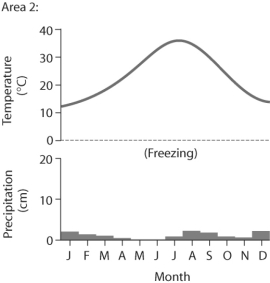 Figure 49.2
-Based on the data in Figure 49.2, which of the following statements is FALSE?
A) Area 2 would be considered a desert because of its low average precipitation.
B) Area 2 has a large annual temperature variation.
C) Area 1 has more average precipitation than area 2.
D) Area 1 would be considered a desert because of its high average temperature.
Correct Answer:

Verified
Correct Answer:
Verified
Q30: According to the latest hypotheses, why do
Q31: For a species to be called "invasive,"
Q32: Which abiotic factor would have the most
Q33: Which is a likely biotic factor limiting
Q34: A certain species of pine tree survives
Q35: Which of the following terms does NOT
Q36: Use the following abstract from the International
Q37: Which of the following statements best describes
Q38: Use the following abstract from the International
Q39: <img src="https://d2lvgg3v3hfg70.cloudfront.net/TB6548/.jpg" alt=" Figure 49.1 -Looking