Multiple Choice
Use the graphs in Figures 29.4 and 29.5 and the following information when answering the corresponding questions.
Canadian and Swiss researchers van der Heijden et al., 1998) interested in factors affecting biodiversity, grew a variety of gra plants in combination with one of four arbuscular mycorrhizal AMF) species, no AMF, or all four AMF species together; and measured plant growth under each set of conditions. All plant species were grown in each plot, so they always competed with each other with the only difference being which AMF were present. Use the graphs in Figure 31.5 to answer the questions
that follow. Note that the x- axis labels indicate the number and identity of AMF species bar 0 = no fungi; bars A- D = individual AMF species; bar A+B+C+D = all AMF species together) . The y- axis indicates the amount grams) of plant biomass for the species shown in italics above each graph. Graph e) is the total biomass grams) of all 11 plant species combined; graph f) is the biomass of Bromus erectus plants only, separated from the total.
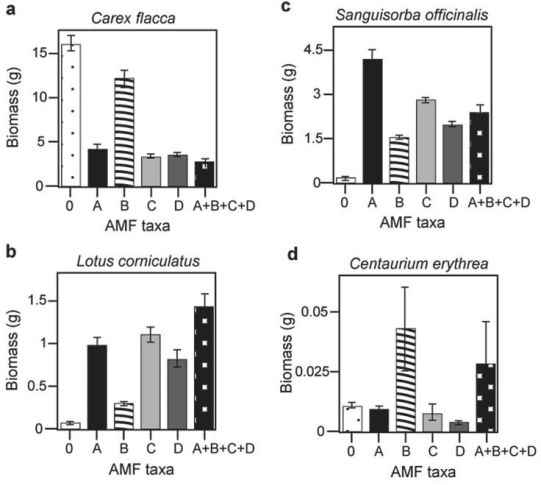 Figure 29.4
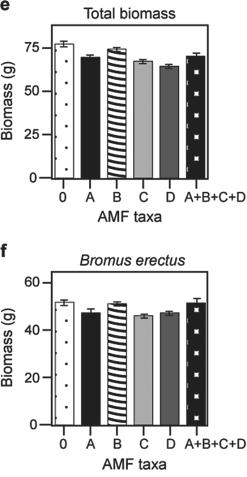 Figure 29.5
-What is the major difference between Bromus erectus graph f) and the other plant species graphs a- d) included in the study?
A) Bromus is unaffected by AMF diversity.
B) Bromus produces very little biomass regardless of AMF.
C) Bromus grows best with a diversity of fungal partners.
D) Bromus does not form mycorrhizal associations.
Correct Answer:

Verified
Correct Answer:
Verified
Q1: Use the following information when answering the
Q2: Why are mycorrhizal fungi superior to plants
Q3: Use the following information when answering the
Q4: It has been hypothesized that fungi and
Q5: Why is it reasonable to hypothesize that
Q7: <img src="https://d2lvgg3v3hfg70.cloudfront.net/TB6548/.jpg" alt=" Figure 29.5 -Based
Q8: It has been hypothesized that fungi and
Q9: You are a forester charged with increasing
Q10: Fungi have an extremely high surface- area-
Q11: The vegetative nutritionally active) bodies of most