Multiple Choice
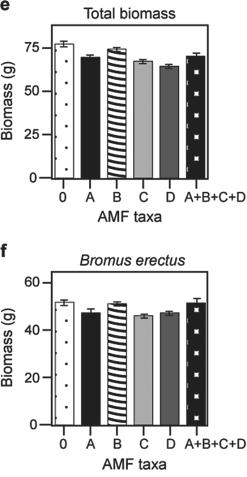 Figure 29.5
-Based on graphs e) and f) in Figure 29.5, which is the most well- supported prediction for the effect on total plant biomass if AMF diversity were increased to eight species?
A) Rare species would produce more biomass compared to the case when fewer AMF are present.
B) Total biomass for eight species would double in comparison to that for four species.
C) No effect is predicted, because the dominant species is non- mycorrhizal.
D) No effect is predicted, because the dominant species is unaffected by AMF diversity.
Correct Answer:

Verified
Correct Answer:
Verified
Q2: Why are mycorrhizal fungi superior to plants
Q3: Use the following information when answering the
Q4: It has been hypothesized that fungi and
Q5: Why is it reasonable to hypothesize that
Q6: Use the graphs in Figures 29.4 and
Q8: It has been hypothesized that fungi and
Q9: You are a forester charged with increasing
Q10: Fungi have an extremely high surface- area-
Q11: The vegetative nutritionally active) bodies of most
Q12: Microsporidians are considered parasitic because of the