Multiple Choice
TABLE 16-5
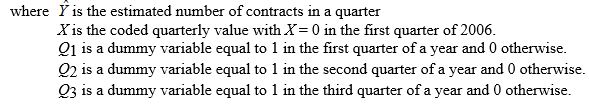
A contractor developed a multiplicative time-series model to forecast the number of contracts in future quarters, using quarterly data on number of contracts during the 3-year period from 2006 to 2008. The following is the resulting regression equation:

-Referring to Table 16-5, the best interpretation of the coefficient of Q3 (0.617) in the regression equation is:
A) the number of contracts in the third quarter of a year is approximately 62% higher than the average over all 4 quarters.
B) the number of contracts in the third quarter of a year is approximately 62% higher than it would be during the fourth quarter.
C) the number of contracts in the third quarter of a year is approximately 314% higher than the average over all 4 quarters.
D) the number of contracts in the third quarter of a year is approximately 314% higher than it would be during the fourth quarter.
Correct Answer:

Verified
Correct Answer:
Verified
Q15: TABLE 16-7<br>The number of passengers arriving at
Q15: Which of the following terms describes the
Q20: TABLE 16-7<br>The number of passengers arriving at
Q50: TABLE 16-6<br>The number of cases of
Q52: TABLE 16-11<br>Business closures in Laramie, Wyoming
Q88: MAD is the summation of the residuals
Q92: TABLE 16-7<br>The number of passengers arriving at
Q129: To assess the adequacy of a forecasting
Q139: TABLE 16-7<br>The number of passengers arriving at
Q155: TABLE 16-11<br>Business closures in Laramie,