Multiple Choice
TABLE 16-13
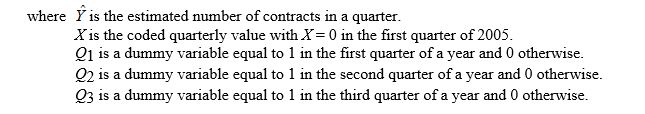
A local store developed a multiplicative time-series model to forecast its revenues in future quarters, using quarterly data on its revenues during the 4-year period from 2005 to 2009. The following is the resulting regression equation:

-Referring to Table 16-13, the best interpretation of the constant 6.102 in the regression equation is:
A) the fitted value for the first quarter of 2005, prior to seasonal adjustment, is log10(6.102) .
B) the fitted value for the first quarter of 2005, after seasonal adjustment, is log10(6.102) .
C) the fitted value for the first quarter of 2005, prior to seasonal adjustment, is 106.102.
D) the fitted value for the first quarter of 2005, after seasonal adjustment, is 106.102.
Correct Answer:

Verified
Correct Answer:
Verified
Q24: Given a data set with 15 yearly
Q87: TABLE 16-3<br>The following table contains the number
Q95: TABLE 16-6<br>The number of cases of merlot
Q96: TABLE 16-5<br>A contractor developed a multiplicative time-series
Q100: TABLE 16-6<br>The number of cases of merlot
Q101: The following is the list of MAD
Q102: TABLE 16-13<br>A local store developed a multiplicative
Q129: TABLE 16-7<br>The number of passengers arriving at
Q147: TABLE 16-11<br>Business closures in Laramie, Wyoming
Q150: A least squares linear trend line is