Multiple Choice
TABLE 16-13
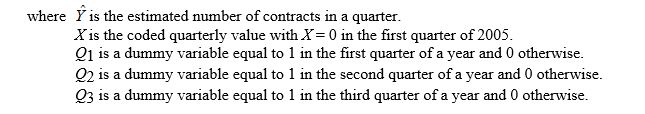
A local store developed a multiplicative time-series model to forecast its revenues in future quarters, using quarterly data on its revenues during the 4-year period from 2005 to 2009. The following is the resulting regression equation:

-Referring to Table 16-13, in testing the significance of the coefficient for Q1 in the regression equation (-0.129) which has a p-value of 0.492. Which of the following is the best interpretation of this result?
A) The revenues in the first quarter of the year are significantly different from the revenues in an average quarter (α = 0.05) .
B) The revenues in the first quarter of the year are not significantly different from the revenues in an average quarter (α = 0.05) .
C) The revenues in the first quarter of the year are significantly different from the revenues in the fourth quarter (α = 0.05) .
D) The revenues in the first quarter of the year are not significantly different from the revenues in the fourth quarter (α = 0.05) .
Correct Answer:

Verified
Correct Answer:
Verified
Q12: TABLE 16-12 <br>The manager of
Q40: TABLE 16-8 <br>The president of a
Q47: TABLE 16-7<br>The number of passengers arriving at
Q52: Which of the following statements about moving
Q53: TABLE 16-7<br>The number of passengers arriving at
Q61: The fairly regular fluctuations that occur within
Q66: TABLE 16-8<br>The president of a chain of
Q67: TABLE 16-10<br>The manager of a marketing consulting
Q69: TABLE 16-10<br>The manager of a marketing consulting
Q71: TABLE 16-12 <br>The manager of