Multiple Choice
TABLE 2-4
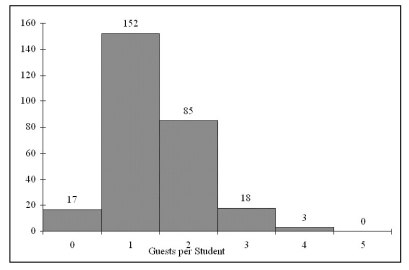
Every spring semester, the School of Business coordinates with local business leaders a luncheon for graduating seniors, their families, and friends. Corporate sponsorship pays for the lunches of each of the seniors, but students have to purchase tickets to cover the cost of lunches served to guests they bring with them. The following histogram represents the attendance at the senior luncheon, where X is the number of guests each graduating senior invited to the luncheon and f is the number of graduating seniors in each category.
-When constructing charts, the following is plotted at the class midpoints:
A) frequency histograms.
B) percentage polygons.
C) cumulative relative frequency ogives.
D) All of the above.
Correct Answer:

Verified
Correct Answer:
Verified
Q62: An insurance company evaluates many numerical variables
Q117: In purchasing an automobile, there are a
Q158: Histograms are used for numerical data while
Q178: You have collected data on the number
Q180: TABLE 2-9<br>The Stem-and-Leaf display represents the number
Q181: TABLE 2-1<br>The manager of the customer service
Q182: TABLE 2-1<br>The manager of the customer service
Q184: TABLE 2-2<br>An insurance company evaluates many numerical
Q185: TABLE 2-18<br>The following table presents total retail
Q187: TABLE 2-16<br>The figure below is the ogive