Multiple Choice
TABLE 2-16
The figure below is the ogive for the amount of fat (in grams) for a sample of 36 pizza products where the upper boundaries of the intervals are: 5, 10, 15, 20, 25, and 30.
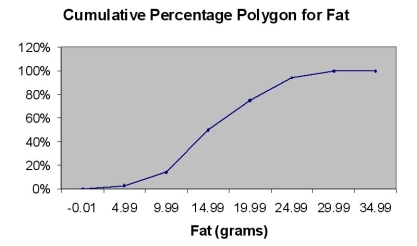
-Referring to Table 2-16, what percentage of pizza products contains at least 20 grams of fat?
A) 5%
B) 25%
C) 75%
D) 96%
Correct Answer:

Verified
Correct Answer:
Verified
Q62: An insurance company evaluates many numerical variables
Q80: The number of defective apples in a
Q158: Histograms are used for numerical data while
Q182: TABLE 2-1<br>The manager of the customer service
Q183: TABLE 2-4<br>Every spring semester, the School of
Q184: TABLE 2-2<br>An insurance company evaluates many numerical
Q185: TABLE 2-18<br>The following table presents total retail
Q189: TABLE 2-17<br>The figure below is the percentage
Q191: TABLE 2-8<br>The Stem-and-Leaf display below contains data
Q192: TABLE 2-15<br>The table below contains the number