Short Answer
TABLE 2-11
The histogram below represents scores achieved by 200 job applicants on a personality profile.
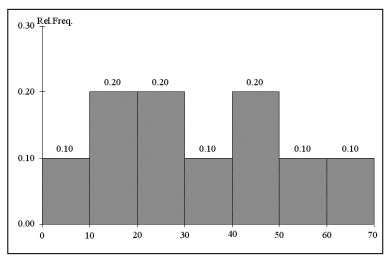
-Referring to the histogram from Table 2-11, ________ percent of the applicants scored between 20 and 50.
Correct Answer:

Verified
Correct Answer:
Verified
Related Questions
Q10: A continuous variable may take on any
Q31: If the values of the seventh and
Q64: The amount of coffee consumed by an
Q146: TABLE 2-13<br>The table below contains the opinions
Q147: TABLE 2-13<br>The table below contains the opinions
Q148: TABLE 2-15<br>The table below contains the number
Q149: TABLE 2-1<br>The manager of the customer service
Q151: TABLE 2-9<br>The Stem-and-Leaf display represents the number
Q154: TABLE 2-17<br>The figure below is the percentage
Q161: A side-by-side chart is two histograms plotted