Multiple Choice
TABLE 2-17
The figure below is the percentage polygon for the amount of calories for a sample of 36 pizzas products where the upper limits of the intervals are: 310, 340, 370, 400 and 430.
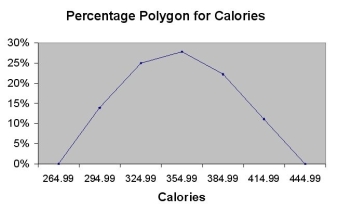
-Referring to Table 2-17, roughly what percentage of pizza products contains between 340 and 400 calories?
A) 22%
B) 25%
C) 28%
D) 50%
Correct Answer:

Verified
Correct Answer:
Verified
Q10: A continuous variable may take on any
Q31: If the values of the seventh and
Q78: Most colleges admit students based on their
Q149: TABLE 2-1<br>The manager of the customer service
Q150: TABLE 2-11<br>The histogram below represents scores achieved
Q151: TABLE 2-9<br>The Stem-and-Leaf display represents the number
Q156: TABLE 2-7<br>A sample of 200 students at
Q157: TABLE 2-13<br>The table below contains the opinions
Q161: A side-by-side chart is two histograms plotted
Q182: A statistics student found a reference in