Multiple Choice
TABLE 2-17
The figure below is the percentage polygon for the amount of calories for a sample of 36 pizzas products where the upper limits of the intervals are: 310, 340, 370, 400 and 430.
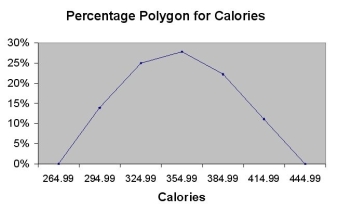
-Referring to Table 2-17, roughly what percentage of pizza products contains between 400 and 430 calories?
A) 0%
B) 11%
C) 89%
D) 100%
Correct Answer:

Verified
Correct Answer:
Verified
Q62: An insurance company evaluates many numerical variables
Q80: The number of defective apples in a
Q158: Histograms are used for numerical data while
Q184: TABLE 2-2<br>An insurance company evaluates many numerical
Q185: TABLE 2-18<br>The following table presents total retail
Q187: TABLE 2-16<br>The figure below is the ogive
Q191: TABLE 2-8<br>The Stem-and-Leaf display below contains data
Q192: TABLE 2-15<br>The table below contains the number
Q193: TABLE 2-6<br>The following are the durations in
Q194: TABLE 2-13<br>The table below contains the opinions