Multiple Choice
Figure 17.1
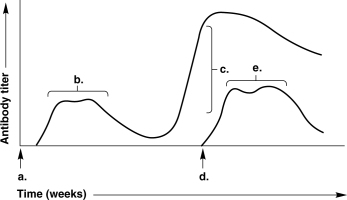
-In Figure 17.1, which letter on the graph indicates the highest antibody titer during the patient's response to a second antigen?
A) a
B) b
C) c
D) d
E) e
Correct Answer:

Verified
Correct Answer:
Verified
Related Questions
Q47: Which of the following is NOT a
Q48: Thymic selection<br>A) destroys T cells that do
Q49: Which of the following statements about natural
Q50: Which of the following is the best
Q51: The presence of which of the following
Q52: Which of the following cells is NOT
Q53: Which one of the following causes transmembrane
Q54: Which of the following recognizes antigens displayed
Q56: Which of the following statements about IL-
Q56: Only dendritic cells produce interleukins.