Multiple Choice
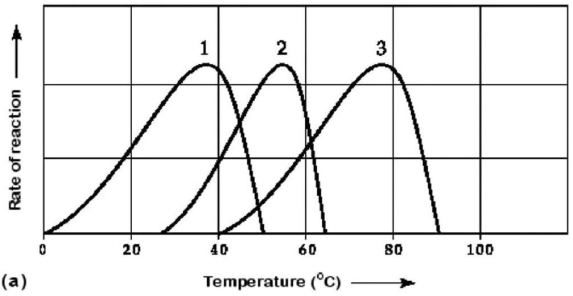
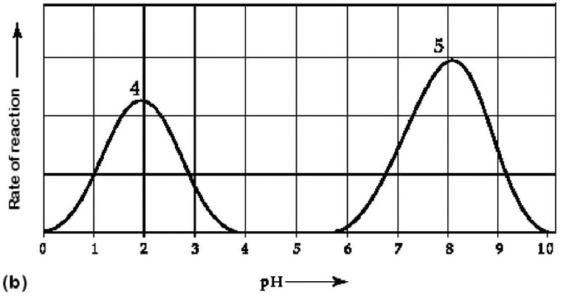 Figure 6.3 Activity of various enzymes (a) at various temperatures and (b) at various pH.
-Which curves on the graphs in Figure 6.3 may represent the temperature and pH profiles of an enzyme taken from a bacterium that lives in a mildly alkaline hot spring at temperatures of 70°C or higher?
A) curves 1 and 5
B) curves 2 and 4
C) curves 2 and 5
D) curves 3 and 4
E) curves 3 and 5
Correct Answer:

Verified
Correct Answer:
Verified
Q45: Which of the descriptions below is an
Q46: Hydrolysis of ATP releases energy,which ultimately results
Q47: When chemical,transport,or mechanical work is performed by
Q48: <img src="https://d2lvgg3v3hfg70.cloudfront.net/TB7910/.jpg" alt=" Figure 6.1 -Which
Q49: <img src="https://d2lvgg3v3hfg70.cloudfront.net/TB7910/.jpg" alt=" Figure 6.4 -Figure
Q51: The ∆G for a particular enzyme-catalyzed reaction
Q52: A chemical reaction that has a positive
Q53: Cooperativity is a form of allosteric activation
Q54: Cells use the ATP cycle shown in
Q55: <img src="https://d2lvgg3v3hfg70.cloudfront.net/TB7910/.jpg" alt=" Figure 6.4 -Figure