Multiple Choice
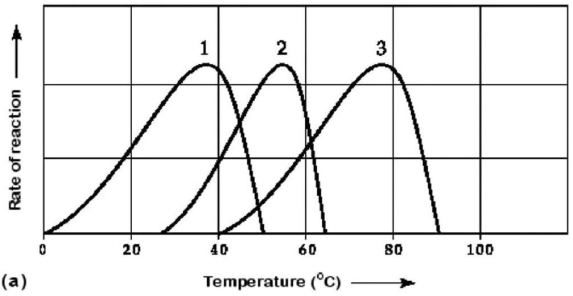
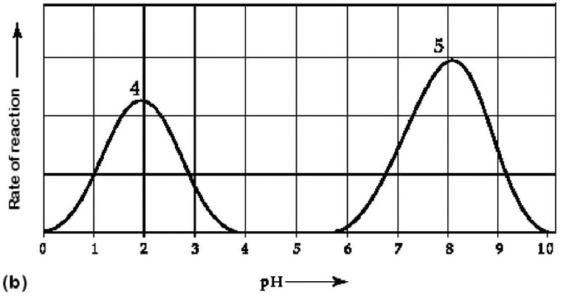 Figure 6.3 Activity of various enzymes (a) at various temperatures and (b) at various pH.
-Which temperature and pH profile curves on the graphs in Figure 6.3 were most likely generated from analysis of an enzyme from a human stomach,where conditions are strongly acidic?
A) curves 1 and 4
B) curves 1 and 5
C) curves 2 and 4
D) curves 2 and 5
E) curves 3 and 4
Correct Answer:

Verified
Correct Answer:
Verified
Q8: Some of the drugs used to treat
Q9: Energy transformations in organisms are always associated
Q10: What is the difference (if any)between the
Q12: The free-energy change for the hydrolysis of
Q14: The active site of an enzyme is
Q15: Anabolic pathways share which of the following
Q16: <img src="https://d2lvgg3v3hfg70.cloudfront.net/TB7910/.jpg" alt=" Figure 6.4 -Figure
Q17: <img src="https://d2lvgg3v3hfg70.cloudfront.net/TB7910/.jpg" alt=" Figure 6.4 -Figure
Q18: If an enzyme in solution is saturated
Q64: Some bacteria are metabolically active in hot