Multiple Choice
The figure below shows the isocost lines and the isoquant map for a firm producing golf tees.
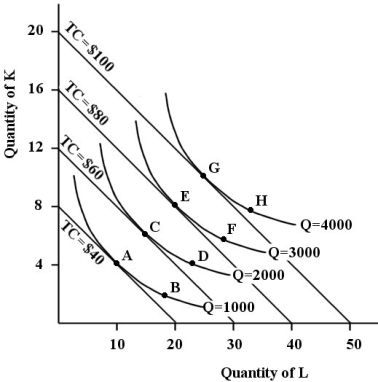 FIGURE 8- 6
-Refer to Figure 8- 6.Suppose this firm is producing 3000 golf tees and is at point F on the isoquant map.In order to maintain its output and minimize costs this firm should
A) move to an isoquant closer to the origin.
B) not change its use of factors.
C) employ more labour and less capital.
D) employ more capital and less labour.
E) move to an isocost line further from the origin.
Correct Answer:

Verified
Correct Answer:
Verified
Q4: The figure below shows the isocost lines
Q30: The figure below shows a family of
Q76: For a firm with only two inputs,capital
Q77: The following table shows the marginal
Q78: When a firm seeks to minimize costs
Q79: Consider a firm that uses only labour
Q82: A short- run average total cost curve
Q83: A firm operates at its least- cost
Q132: Suppose that capital costs $50 per unit
Q136: <img src="https://d2lvgg3v3hfg70.cloudfront.net/TB5441/.jpg" alt=" FIGURE 8-1 -Refer