Multiple Choice
The figure below shows the isocost lines and the isoquant map for a firm producing golf tees. 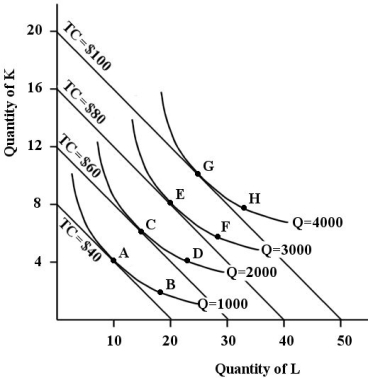 FIGURE 8-6
-Refer to Figure 8-6.This firm will minimize its costs of producing 2000 golf tees at point
A) A.
B) B.
C) C.
D) D.
E) E.
Correct Answer:

Verified
Correct Answer:
Verified
Q1: <img src="https://d2lvgg3v3hfg70.cloudfront.net/TB5441/.jpg" alt=" FIGURE 8-1 -Refer
Q2: Suppose a firm is using 1500 units
Q3: In the long run,decreasing returns to scale
Q5: Refer to Figure 8-6.Suppose this firm is
Q6: <img src="https://d2lvgg3v3hfg70.cloudfront.net/TB5441/.jpg" alt=" FIGURE 8-4 -Refer
Q7: For a firm with only two inputs,capital
Q8: Consider the long-run average cost curve for
Q9: Consider a firm that uses only labour
Q10: TABLE 8-1<br> <img src="https://d2lvgg3v3hfg70.cloudfront.net/TB5441/.jpg" alt="TABLE 8-1
Q11: Assume a firm is using 6 units