Multiple Choice
FIGURE 8- 2
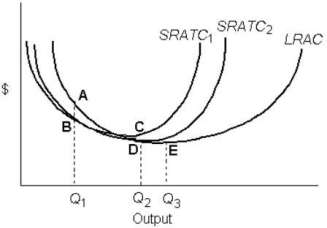
-Refer to Figure 8- 2.Increasing returns to scale occur over the output range
A) beyond Q3 only.
B) Q1 to Q2 only.
C) 0 to Q3 only.
D) Q2 to Q3 only.
E) 0 to Q1 only.
Correct Answer:

Verified
Correct Answer:
Verified
Q3: Consider the short- run and long- run
Q4: In the long run,a profit- maximizing firm
Q5: Suppose that capital costs $10 per unit
Q6: Which of the following factors is most
Q8: FIGURE 8- 4 <img src="https://d2lvgg3v3hfg70.cloudfront.net/TB5440/.jpg" alt="FIGURE 8-
Q9: Isocost lines are downward sloping straight lines,reflecting<br>A)decreasing
Q11: The figure below shows a family of
Q12: When a cost- minimizing firm is faced
Q59: Suppose that capital costs $6 per unit
Q77: TABLE 8-1<br> <img src="https://d2lvgg3v3hfg70.cloudfront.net/TB5441/.jpg" alt="TABLE 8-1