Multiple Choice
The figure below shows a family of cost curves for a firm.The subscripts 1,2,and 3 for the SRATC curves refer to different plant sizes.
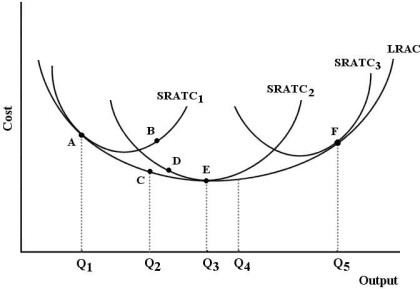 FIGURE 8- 3
-Refer to Figure 8- 3.Each of the three SRATC curves shows
A) the lowest cost attainable,holding the plant size constant.
B) optimal plant sizes in the long run.
C) the lowest cost attainable,given that the plant size is the largest it can possibly be.
D) technically inefficient methods of production,given that they lie above the LRAC.
E) the output that is possible when all factors of production are fixed.
Correct Answer:

Verified
Correct Answer:
Verified
Q6: Which of the following factors is most
Q7: FIGURE 8- 2 <br> <img src="https://d2lvgg3v3hfg70.cloudfront.net/TB5440/.jpg" alt="FIGURE
Q8: FIGURE 8- 4 <img src="https://d2lvgg3v3hfg70.cloudfront.net/TB5440/.jpg" alt="FIGURE 8-
Q9: Isocost lines are downward sloping straight lines,reflecting<br>A)decreasing
Q12: When a cost- minimizing firm is faced
Q13: Consider the short- run and long- run
Q14: Consider the long- run average cost curve
Q15: "The bigger the volume,the lower the cost,and
Q77: TABLE 8-1<br> <img src="https://d2lvgg3v3hfg70.cloudfront.net/TB5441/.jpg" alt="TABLE 8-1
Q105: TABLE 8-1<br> <img src="https://d2lvgg3v3hfg70.cloudfront.net/TB5441/.jpg" alt="TABLE 8-1