Multiple Choice
The diagram below shows some short- run cost curves for a firm.
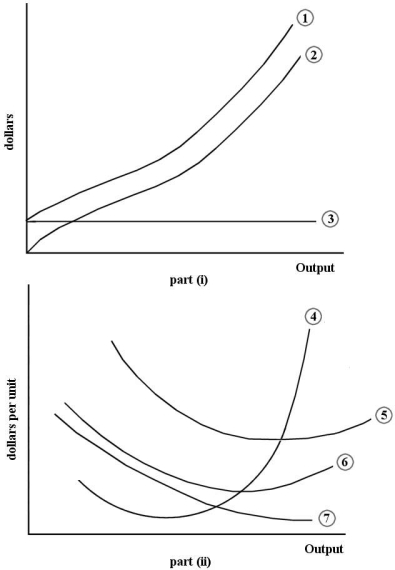 FIGURE 7- 2
-Refer to Figure 7- 2.Which of the following choices correctly identifies the cost curves in part (i) of the figure?
A) Curve 1 is the total variable cost curve.Curve 2 is the total cost curve. Curve 3 is the total fixed cost curve.
B) Curve 1 is the total fixed cost curve.Curve 2 is the total variable cost curve.Curve 3 is the total cost curve.
C) Curve 1 is the total cost curve. Curve 2 is the total variable cost curve.Curve 3 is the average fixed cost curve.
D) Curve 1 is the total cost curve. Curve 2 is the total variable cost curve.Curve 3 is the total fixed cost curve.
E) Curve 1 is the total marginal cost curve.Curve 2 is the total average cost curve.Curve 3 is the total average fixed cost curve.
Correct Answer:

Verified
Correct Answer:
Verified
Q60: The table below provides information on output
Q104: The following data show the total
Q105: Consider a firm in the short run.When
Q106: The following data show the total
Q107: Suppose a firm is producing 10 000
Q108: The following data show the total
Q109: What information is provided by average,marginal,and total
Q111: The following data show the total
Q113: Consider a firm in the short run.Average
Q134: The following data show the total output