Multiple Choice
FIGURE 2- 3 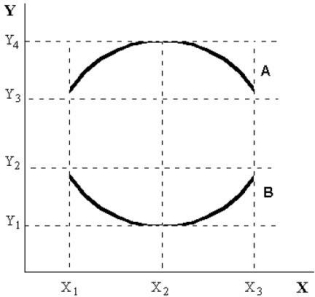
-At the minimum or the maximum of the graph of a non- linear function (with x on the horizontal axis and y on the vertical axis) the marginal response of y to a small change in x is
A) 0.
B) 1.
C) undefined.
D) - 1.
E) infinite.
Correct Answer:

Verified
Correct Answer:
Verified
Q59: The table below shows hypothetical tuition
Q60: Of the following,which is the most important
Q61: Which of the following statements belongs more
Q62: Choose the statement that best characterizes an
Q63: Choose the answer that best explains why
Q65: FIGURE 2- 4 <img src="https://d2lvgg3v3hfg70.cloudfront.net/TB5440/.jpg" alt="FIGURE 2-
Q66: The base year for an index number
Q67: The statement that a country's rate of
Q68: The table below shows hypothetical data
Q69: The table below shows hypothetical tuition