Multiple Choice
FIGURE 2- 4 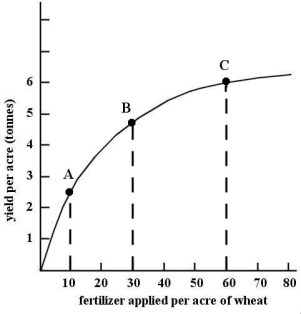
-Refer to Figure 2- 4.The slope of the non- linear function changes as we move along the curve.The slope is
A) negative and decreasing,indicating a diminishing marginal response.
B) constant at all points,indicating a constant marginal response.
C) negative and increasing,indicating an increasing marginal response.
D) positive and increasing,indicating an increasing marginal response.
E) positive and decreasing,indicating a diminishing marginal response.
Correct Answer:

Verified
Correct Answer:
Verified
Q60: Of the following,which is the most important
Q61: Which of the following statements belongs more
Q62: Choose the statement that best characterizes an
Q63: Choose the answer that best explains why
Q64: FIGURE 2- 3 <img src="https://d2lvgg3v3hfg70.cloudfront.net/TB5440/.jpg" alt="FIGURE 2-
Q66: The base year for an index number
Q67: The statement that a country's rate of
Q68: The table below shows hypothetical data
Q69: The table below shows hypothetical tuition
Q70: If we seek to explain the number