Multiple Choice
The diagram below shows an AD/AS model for a hypothetical economy.The economy begins in long-run equilibrium at point A.
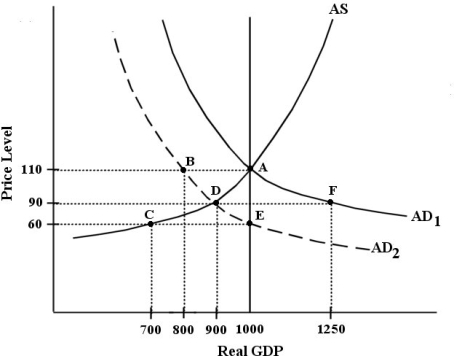 FIGURE 24-3
-Refer to Figure 24-3.A negative shock to the economy shifts the AD curve from AD1 to AD2.The initial effect is
A) a recessionary output gap of 100.
B) a recessionary output gap of 300.
C) a recessionary output gap of 550.
D) an inflationary output gap of 200.
E) an inflationary output gap of 100.
Correct Answer:

Verified
Correct Answer:
Verified
Q1: In the basic AD/AS model,which of the
Q8: One advantage of using expansionary fiscal policy
Q16: Which of the following is a defining
Q17: The diagram below shows an AD/AS model
Q29: The curve that is sometimes called the
Q37: The diagram below shows an AD/AS model
Q66: Net tax revenues that rise with national
Q94: When an economy experiences sustained growth in
Q124: Which of the following is a defining
Q149: Which of the following best describes the