Multiple Choice
The diagram below shows an AD/AS model for a hypothetical economy which is initially in a short-run equilibrium at point A. 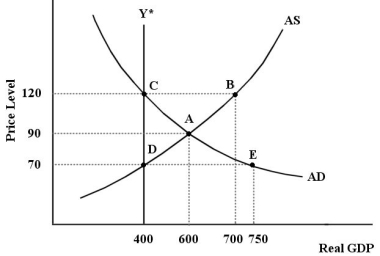 FIGURE 24-7
-Refer to Figure 24-7.If the government takes no action to close the existing output gap,then
A) the AD curve will shift down until it intersects with the AS curve at point D.
B) the AD curve will shift up until it intersects with the AS curve at point B.
C) the AS curve will shift to the left until it intersects with the AD curve at point C.
D) the AS curve will shift to the right until it intersects with the AD curve at point E.
E) the AS curve can either shift to the right or left depending on the fiscal policy.
Correct Answer:

Verified
Correct Answer:
Verified
Q2: A recessionary output gap is characterized by<br>A)rising
Q13: Suppose the economy is experiencing a significant
Q14: <img src="https://d2lvgg3v3hfg70.cloudfront.net/TB5441/.jpg" alt=" FIGURE 24-1 -Refer
Q15: The diagram below shows an AD/AS model
Q16: Which of the following is a defining
Q19: When we study the adjustment process in
Q21: <img src="https://d2lvgg3v3hfg70.cloudfront.net/TB5441/.jpg" alt=" FIGURE 24-1 -Refer
Q22: The diagram below shows an AD/AS model
Q25: Suppose the economy is experiencing an inflationary
Q146: Which of the following would occur as