Multiple Choice
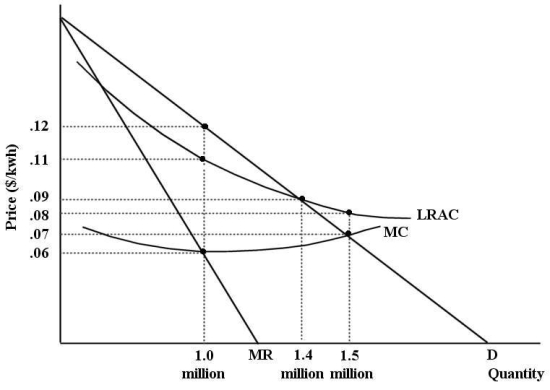
The diagram below shows cost and revenue curves for a natural monopoly producing electricity.Price is dollars per kilowatt hour and quantity is kilowatt hours per day.  FIGURE 12-7
-Refer to Figure 12-7.Suppose this firm is being regulated using a pricing policy of average-cost pricing.In this case,economic profits are equal to
A) $10 000.
B) $6000.
C) $126 000.
D) $28 000.
E) $0.
Correct Answer:

Verified
Correct Answer:
Verified
Q49: One method of regulating a natural monopoly
Q50: Suppose a cell-phone service provider has monopoly
Q51: The deadweight loss of monopoly is<br>A)its fixed
Q52: Which of the following is an example
Q53: We can safely say that each point
Q55: Productive efficiency for an individual firm requires
Q56: The diagram below shows the demand and
Q57: Consider three firms,A,B and C,all producing kilos
Q58: In the long run,the imposition of average-cost
Q59: The diagram below shows supply,demand,and quantity exchanged