Multiple Choice
The table below shows hypothetical data for the volume of gold and nickel output across several years.
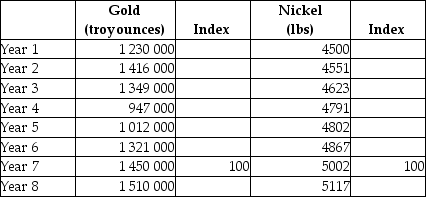 TABLE 2-6
-Refer to Table 2-6.What is the index number for gold output in Year 8?
A) 104.1%
B) 104.1
C) 1.04
D) 60
E) 60%
Correct Answer:

Verified
Correct Answer:
Verified
Q51: Consider the functional relationship between two variables,X
Q79: On a coordinate graph with y on
Q83: The table below shows the approximate value
Q87: When using statistics in economics,the possibility of
Q88: Suppose economists at the Department of Finance
Q89: <img src="https://d2lvgg3v3hfg70.cloudfront.net/TB5441/.jpg" alt=" FIGURE 2-3 -Refer
Q90: For a given year,an index number of
Q94: When an increase in one variable is
Q131: A scatter diagram<br>A)is a graph of a
Q141: Suppose a theory predicts that lowering tuition