Multiple Choice
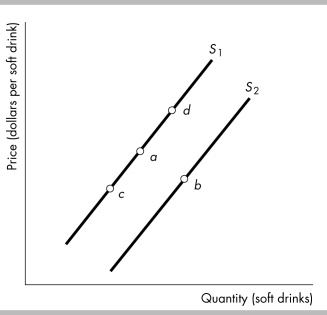
-Consider the figure above showing supply curves for soft drinks. Suppose the economy is at point
A.A movement to point d would be the result of
A) an increase in the number of soft drink suppliers.
B) an increase in technology.
C) a decrease in the relative price of a soft drink.
D) an increase in the relative price of a soft drink.
Correct Answer:

Verified
Correct Answer:
Verified
Q103: <img src="https://d2lvgg3v3hfg70.cloudfront.net/TB8586/.jpg" alt=" -The above figures
Q179: <img src="https://d2lvgg3v3hfg70.cloudfront.net/TB8586/.jpg" alt=" -The above figures
Q332: The price of a computer is $1,000
Q354: When the demand and supply curves both
Q355: <img src="https://d2lvgg3v3hfg70.cloudfront.net/TB5270/.jpg" alt=" -In the above
Q357: Producers of DVDs are able to lower
Q360: Suppose we observe that both the equilibrium
Q361: If the price of cars falls, the
Q387: What is the effect on the price
Q467: <img src="https://d2lvgg3v3hfg70.cloudfront.net/TB8586/.jpg" alt=" -The above figures