Multiple Choice
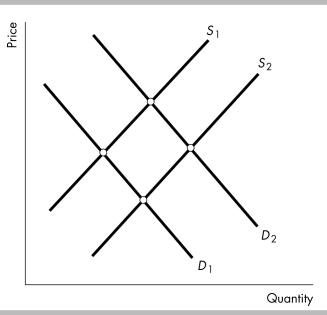
-The above figure represents the market for oil. When a hurricane destroys a major refinery the
A) demand curve for oil does not shift, and the supply curve for oil shifts from S2 to S1.
B) demand curve for oil shifts from D1 to D2 and the supply curve for oil shifts from S2 to S1.
C) demand curve for oil does not shift, and the supply curve for oil shifts from S1 to S2.
D) demand curve for oil shifts from D1 to D2 and the supply curve for oil does not shift.
Correct Answer:

Verified
Correct Answer:
Verified
Q38: <img src="https://d2lvgg3v3hfg70.cloudfront.net/TB8586/.jpg" alt=" -The above figures
Q83: An economist says: "The demand curve has
Q538: What will happen to the equilibrium price
Q539: If the price of an apple increases
Q540: <img src="https://d2lvgg3v3hfg70.cloudfront.net/TB5270/.jpg" alt=" -In the figure
Q541: The "law of supply" states that, other
Q543: Doctors find that one aspirin per day
Q544: A price below the equilibrium price results
Q546: When income increases, the demand curve for
Q547: All of the following statements are true