Multiple Choice
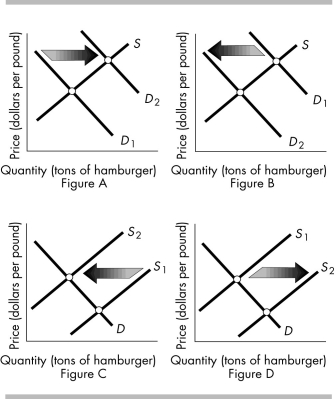
-The above figures show the market for hamburger meat. Which figure(s) shows the effect of an increase in the price of a substitute like hot dogs?
A) Figure A
B) Figure C
C) Figure D
D) Figures A and C
Correct Answer:

Verified
Correct Answer:
Verified
Q33: <img src="https://d2lvgg3v3hfg70.cloudfront.net/TB8586/.jpg" alt=" -In the figure
Q34: <img src="https://d2lvgg3v3hfg70.cloudfront.net/TB8586/.jpg" alt=" -A market research
Q35: <img src="https://d2lvgg3v3hfg70.cloudfront.net/TB8586/.jpg" alt=" -Consider the demand
Q36: <img src="https://d2lvgg3v3hfg70.cloudfront.net/TB8586/.jpg" alt=" -The figure above
Q37: Sweatshirts and tee-shirts are complements in consumption
Q39: Which of the following shifts the demand
Q40: When demand increases, the equilibrium price _
Q41: <img src="https://d2lvgg3v3hfg70.cloudfront.net/TB8586/.jpg" alt=" -The above figures
Q42: A relative price is the<br>A) slope of
Q43: The "law of demand" predicts that, other