Multiple Choice
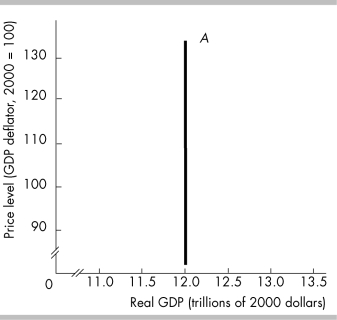
-The curve labeled A in the above figure is a
A) short- run aggregate demand curve.
B) long- run aggregate supply curve.
C) short- run aggregate supply curve.
D) long- run aggregate demand curve.
Correct Answer:

Verified
Correct Answer:
Verified
Q14: Compare the policy prescriptions of Keynesian, Classical,
Q360: <img src="https://d2lvgg3v3hfg70.cloudfront.net/TB5270/.jpg" alt=" -The data in
Q361: An individual holds $10,000 in a checking
Q362: At long- run macroeconomic equilibrium, .<br>A) real
Q363: The aggregate demand curve illustrates relationship between
Q364: The long- run aggregate supply (LAS) curve<br>A)
Q365: A monetarist economist believes that if the
Q366: Which of the following statements is TRUE?<br>A)
Q367: Your real wealth is measured as the<br>A)
Q369: The government increases taxes. As a result,