Multiple Choice
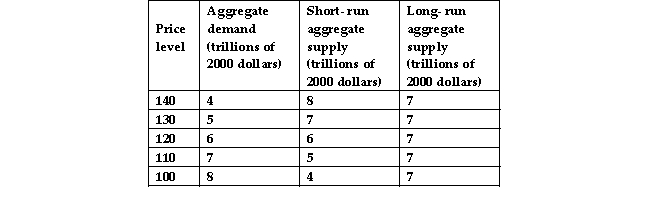
-The data in the above table show that when the price level is 120, if aggregate demand does not change then the
A) long- run aggregate supply curve will shift leftward.
B) long- run aggregate supply curve will shift rightward.
C) short- run aggregate supply curve will shift leftward.
D) short- run aggregate supply curve will shift rightward.
Correct Answer:

Verified
Correct Answer:
Verified
Q82: <img src="https://d2lvgg3v3hfg70.cloudfront.net/TB6802/.jpg" alt=" -In the above
Q281: Assume the equilibrium price level is 140
Q355: <img src="https://d2lvgg3v3hfg70.cloudfront.net/TB5270/.jpg" alt=" -In the above
Q358: Suppose the value of the U.S. dollar
Q359: In a short- run macroeconomic equilibrium, real
Q361: An individual holds $10,000 in a checking
Q362: At long- run macroeconomic equilibrium, .<br>A) real
Q363: The aggregate demand curve illustrates relationship between
Q364: The long- run aggregate supply (LAS) curve<br>A)
Q365: <img src="https://d2lvgg3v3hfg70.cloudfront.net/TB5270/.jpg" alt=" -The curve labeled