Multiple Choice
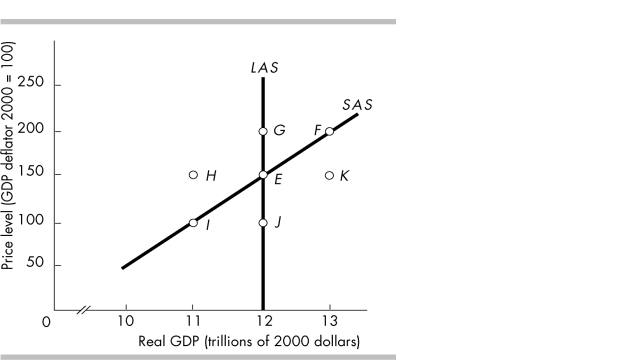
-In the above figure, which movement illustrates the impact of a constant price level and a rising money wage rate?
A) E to H
B) E to F
C) E to J
D) E to I
Correct Answer:

Verified
Correct Answer:
Verified
Q119: The long-run aggregate supply curve is vertical.
Q343: An increase in the quantity of money<br>A)
Q345: A Keynesian economist believes that<br>A) the economy
Q346: <img src="https://d2lvgg3v3hfg70.cloudfront.net/TB5270/.jpg" alt=" -In the above
Q347: Assume the economy is at long run
Q349: A decrease in short- run aggregate supply
Q351: <img src="https://d2lvgg3v3hfg70.cloudfront.net/TB5270/.jpg" alt=" -The economy is
Q352: Higher resource prices shift the<br>A) short- run
Q397: The short-run aggregate supply curve shows a
Q409: <img src="https://d2lvgg3v3hfg70.cloudfront.net/TB8586/.jpg" alt=" -Based on the