menu-iconExamlexExamLexServices

Discover

Ask a Question
  1. All Topics
  2. Topic
    Business
  3. Study Set
    Macroeconomics Study Set 40
  4. Exam
    Exam 10: Aggregate Supply and Aggregate Demand
  5. Question
    -In the Above Figure, the Aggregate Demand Curve Is AD<sub>2</sub>
Solved

-In the Above Figure, the Aggregate Demand Curve Is AD2

Question 346

Question 346

Multiple Choice

  -In the above figure, the aggregate demand curve is AD<sub>2</sub>, so the short- run equilibrium level of real GDP is A)  between $12 and $12.5 trillion. B)  $12.5 trillion. C)  $12 trillion. D)  None of the above answers is correct.
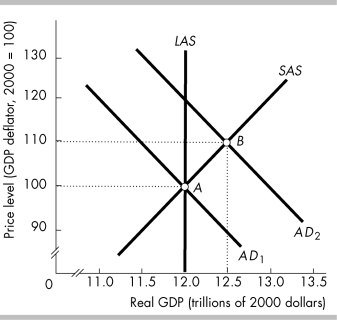
-In the above figure, the aggregate demand curve is AD2, so the short- run equilibrium level of real GDP is


A) between $12 and $12.5 trillion.
B) $12.5 trillion.
C) $12 trillion.
D) None of the above answers is correct.

Correct Answer:

verifed

Verified

Unlock this answer now
Get Access to more Verified Answers free of charge

Related Questions

Q341: With an increase in the capital stock,

Q342: The aggregate supply/aggregate demand model is used

Q343: An increase in the quantity of money<br>A)

Q345: A Keynesian economist believes that<br>A) the economy

Q347: Assume the economy is at long run

Q348: <img src="https://d2lvgg3v3hfg70.cloudfront.net/TB5270/.jpg" alt=" -In the above

Q349: A decrease in short- run aggregate supply

Q351: <img src="https://d2lvgg3v3hfg70.cloudfront.net/TB5270/.jpg" alt=" -The economy is

Q397: The short-run aggregate supply curve shows a

Q409: <img src="https://d2lvgg3v3hfg70.cloudfront.net/TB8586/.jpg" alt=" -Based on the

Examlex

ExamLex

About UsContact UsPerks CenterHomeschoolingTest Prep

Work With Us

Campus RepresentativeInfluencers

Links

FaqPricingChrome Extension

Download The App

Get App StoreGet Google Play

Policies

Privacy PolicyTerms of ServiceHonor CodeCommunity Guidelines

Scan To Download

qr-code

Copyright © (2025) ExamLex LLC.

Privacy PolicyTerms Of ServiceHonor CodeCommunity Guidelines