menu-iconExamlexExamLexServices

Discover

Ask a Question
  1. All Topics
  2. Topic
    Business
  3. Study Set
    Macroeconomics Study Set 40
  4. Exam
    Exam 10: Aggregate Supply and Aggregate Demand
  5. Question
    -In the Above Figure, the Inflationary Gap When AD<sub>2</sub><sub> </Sub>is
Solved

-In the Above Figure, the Inflationary Gap When AD2 is

Question 237

Question 237

Multiple Choice

  -In the above figure, the inflationary gap when AD<sub>2</sub><sub> </sub>is the aggregate demand curve equals A)  AD<sub>1</sub>. B)  the difference between $12.5 trillion and $12.0 trillion. C)  the difference between 110 and 100. D)  LAS minus SAS at a price level of 100.
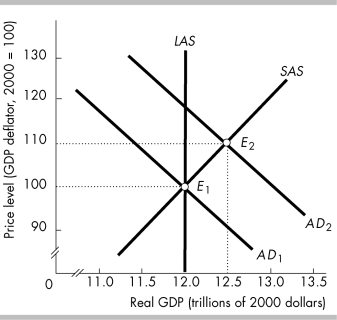
-In the above figure, the inflationary gap when AD2 is the aggregate demand curve equals


A) AD1.
B) the difference between $12.5 trillion and $12.0 trillion.
C) the difference between 110 and 100.
D) LAS minus SAS at a price level of 100.

Correct Answer:

verifed

Verified

Unlock this answer now
Get Access to more Verified Answers free of charge

Related Questions

Q93: <img src="https://d2lvgg3v3hfg70.cloudfront.net/TB6802/.jpg" alt=" -The above figure

Q211: What happens if the economy is at

Q233: The table below shows the price level

Q234: The table below shows data for India's

Q236: Aggregate demand decreases when<br>A) businesses come to

Q239: The short- run aggregate supply curve<br>A) shifts

Q241: In short- run macroeconomic equilibrium<br>A) real GDP

Q242: When the price level increases, .<br>A) aggregate

Q263: In the long-run, the quantity of real

Q288: Which of the following can be said

Examlex

ExamLex

About UsContact UsPerks CenterHomeschoolingTest Prep

Work With Us

Campus RepresentativeInfluencers

Links

FaqPricingChrome Extension

Download The App

Get App StoreGet Google Play

Policies

Privacy PolicyTerms of ServiceHonor CodeCommunity Guidelines

Scan To Download

qr-code

Copyright © (2025) ExamLex LLC.

Privacy PolicyTerms Of ServiceHonor CodeCommunity Guidelines