Multiple Choice
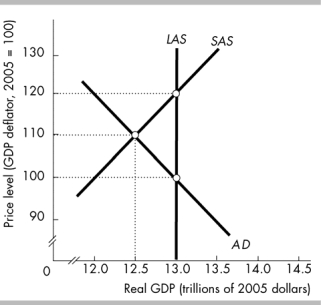
-The above figure illustrates
A) a full-employment equilibrium.
B) an inflationary gap.
C) a recessionary gap.
D) an equilibrium at the economyʹs physical limits.
Correct Answer:

Verified
Correct Answer:
Verified
Q88: <img src="https://d2lvgg3v3hfg70.cloudfront.net/TB6802/.jpg" alt=" -In the above
Q89: <img src="https://d2lvgg3v3hfg70.cloudfront.net/TB6802/.jpg" alt=" -In the above
Q90: <img src="https://d2lvgg3v3hfg70.cloudfront.net/TB6802/.jpg" alt=" -In the above
Q91: Moving along the short-run aggregate supply curve,_<br>A)
Q92: An increase in aggregate demand is shown
Q94: According to the intertemporal substitution effect, when
Q95: Assume the economy is at long run
Q96: An economy is at full employment. Which
Q97: When the prices of U.S.-produced goods rise
Q98: <img src="https://d2lvgg3v3hfg70.cloudfront.net/TB6802/.jpg" alt=" -In the figure